Analysing Hacker News: Trends, Topics, and Influence
Preface: this write-up is currently incomplete.
Introduction
This project aims to explore historical patterns in posts and comments on Hacker News using data mining and machine learning techniques. I set out to answer three key questions:
Q1. How has the popularity of programming languages changed over time? Q2. What categories of content are most popular on Hacker News? Q3. Which users have accumulated the most influence on the platform?
To answer these questions, I collected my own copy of the complete history of posts and comments, totally 45 million items, using the Hacker News API and created a system for querying keywords and their relative popularity, to answer Q1, then I applied machine learning techniques found in Topic Modeling for Q2, and finally I simply queried user metrics to approach Q3.
Data Collection
I collected all posts (stories) and comments from Hacker News using the Hacker News API.
Collection Architecture
The collection system used parallel processing to efficiently download millions of items:
- 20 parallel worker processes requesting data simultaneously
- PostgreSQL database for data storage and tracking completion of jobs.
- Job management system to coordinate workers and prevent duplicate downloads
- Asynchronous operations to avoid blocking on API calls
The dispatcher.py script managed worker instances and assigned jobs (ranges of item IDs to download). A jobs table in PostgreSQL tracked which portions of the data had been downloaded, allowing the system to resume after interruptions where it had left off.
Example API Response
1
2
3
4
5
6
7
8
9
10
11
{
  "by" : "dhouston",
  "descendants" : 71,
  "id" : 8863,
  "kids" : [ 9224, 8917, 8884, 8887, 8952, 8869, 8873, 8958, 8940, 8908, 9005, 9671, 9067, 9055, 8865, 8881, 8872, 8955, 10403, 8903, 8928, 9125, 8998, 8901, 8902, 8907, 8894, 8870, 8878, 8980, 8934, 8943, 8876 ],
  "score" : 104,
  "time" : 1175714200,
  "title" : "My YC app: Dropbox - Throw away your USB drive",
  "type" : "story",
  "url" : "http://www.getdropbox.com/u/2/screencast.html"
}
Evolution of the Collection System
The data collection process evolved through several iterations:
Initial prototype: Simple single-threaded program using an SQLite database. I was familiar with SQLite, and so it was my first choice.
Multiprocessing implementation: Reduced collection time from ~100 days to ~10 days. This was a simple speed-up, as each data item needed to be fetched independently, it was a perfect use-case for parallelism.
Migration to PostgreSQL: This allowed for JSONB storage which I wanted for the kids column. Additionally, I wanted to explore using PostgreSQL and it’s functionality. I made use of the Dbeaver database management tool throughout this project.
Job-based coordination: Added the jobs table system for fault tolerance and resumability. By having this system, I meant any “job” could be picked up by a worker instance as long as it was not currently underway, so no portion of the work was tied to any given running instance, so it was easy to stop the system and increase the number of workers if needed, with minimal loss. Writes to the database were also now being done in large chunks, as I’d read this would increase efficiency [add sources]
Data Processing
Full-Text Search Setup
To enable fast keyword searches across millions of documents, I used PostgreSQL’s full-text search capabilities. The text content was transformed into a tsvector column, which:
- Stems words to their root forms (e.g., “running” → “run”)
- Normalizes text for consistent matching
- Enables fast searches through a GIN (Generalized Inverted Index)
Database Indexes
Key indexes created for performance:
1
2
3
4
5
-- Full-text search
CREATE INDEX items_text_search_idx ON public.items USING GIN(text_search_vector);

-- Time-series queries
CREATE INDEX idx_items_time ON items (time);
Query Pattern for Time-Series Analysis
Keyword frequency queries followed this pattern:
1
2
3
4
5
6
7
SELECT
  date_trunc(:time_bin, to_timestamp(time)) AS time_period,
  COUNT(*) AS post_count
FROM items
WHERE text_search_vector @@ plainto_tsquery('english', :keyword)
GROUP BY time_period
ORDER BY time_period ASC
This returns well-ordered time-series data in configurable time bins (day, week, month, or year).
TimescaleDB
If I return to work on this project again, I’m very interested in how TimescaleDB (Built on top of Postgres) could help to make my data storage and retrieval system more efficient. It’s Hypertables suggest I could get faster database read speeds via chunking. Additionally, I believe an in-memory database would be a great way to speed up my system, however I do not have access to such memory at this time.
Analysis 1: Programming Language Popularity Over Time
Methodology
I built a Flask web application that queries the PostgreSQL database for keyword frequencies over time. The system:
- Uses SQLAlchemy to execute time-series queries. This allowed for database-agnosticism.
- Normalizes frequencies (mentions per 100 total posts + comments) to account for Hacker News’s growth
- Applies rolling averages to smooth short-term fluctuations
- Generates matplotlib visualizations comparing multiple keywords
The web interface allows users to enter keywords, select time bins, and configure rolling average windows. Results are cached for faster subsequent queries.
Results
[FINDINGS TO BE ADDED]
Example visualisation:
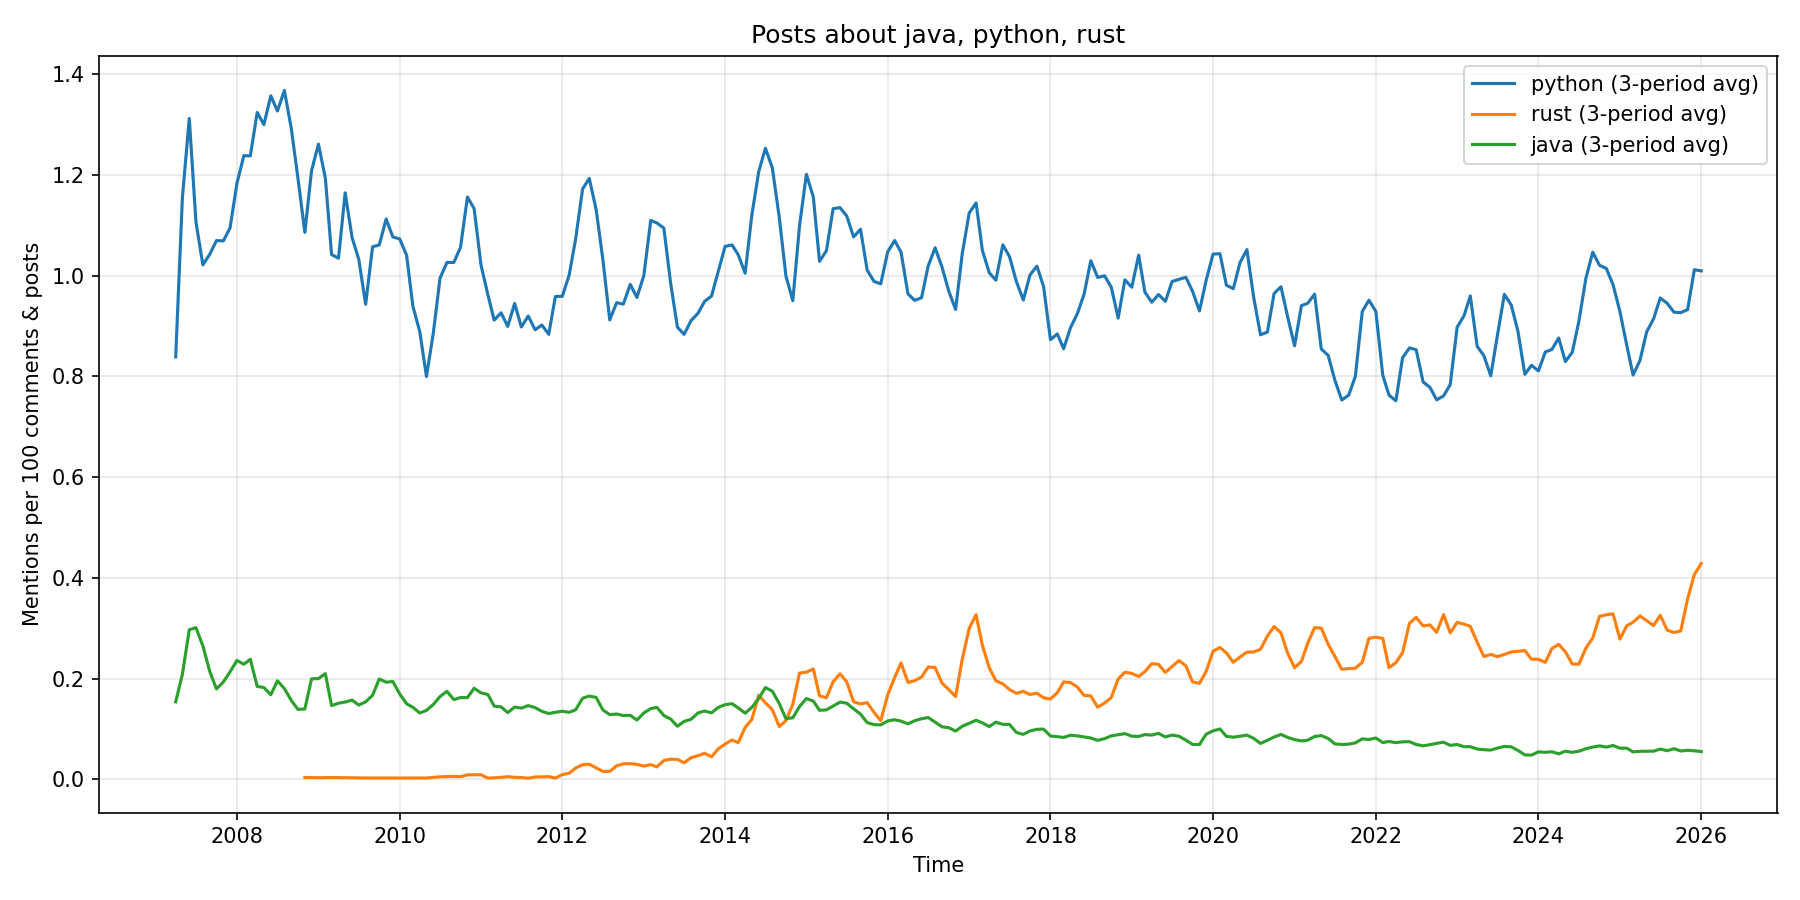
Key observations:
[INSERT FINDINGS ABOUT LANGUAGE TRENDS]
- [Language popularity shifts]
- [AI/ML growth patterns]
- [Notable inflection points]
- [Identifiable events]
Analysis 2: Topic Modeling of Popular Posts
The Challenge: Beyond Simple Keywords
Simple keyword searches proved insufficient for understanding what Hacker News discusses. The challenges included:
- Polysemy: Words with multiple meanings (e.g., “Go” as a programming language vs. a verb)
- False positives: Context-dependent interpretation required
- Unknown patterns: Cannot discover topics without knowing what to search for
After researching approaches to this problem, I discovered Topic Modeling – a family of techniques designed to automatically discover abstract topics in document collections.
Choosing a Approach
I explored several topic modeling approaches:
- Latent Dirichlet Allocation (LDA): A classical probabilistic approach
- BERTopic: A modern transformer-based approach
I chose BERTopic because it:
- Uses transformer models (BERT) to understand semantic context, not just word co-occurrence
- Automatically discovers topics without predefined categories
- Produces interpretable results with clear keyword representations
- Leverages state-of-the-art natural language processing
BERTopic Implementation
The BERTopic pipeline consists of four stages:
- Sentence embeddings: Documents are converted to 384-dimensional vectors using the
all-MiniLM-L6-v2model - Dimensionality reduction: UMAP reduces embeddings to 5 dimensions for clustering
- Clustering: HDBSCAN groups similar documents into topics
- Topic representation: The most distinctive keywords are extracted for each cluster
Results
[FINDINGS TO BE ADDED]
Data analysed:
- [Number of documents]
- [Time period covered]
- [Number of topics discovered]
Major topic categories:
[INSERT TOPIC FINDINGS]
- [Top topics with descriptions]
- [Topic score analysis]
- [Temporal topic trends]
Example topics discovered:
1
2
3
4
5
6
7
8
9
Topic 1: AI, coding, model, agents, agent
  - 68 documents, avg score: 765.8
  - Discussion of AI coding assistants and autonomous agents

Topic 3: apple, backdoor, uk, macos, encryption
  - 33 documents, avg score: 827.4
  - Privacy and encryption policy debates

[INSERT ADDITIONAL EXAMPLE TOPICS]
Visualisations:
[INSERT CLUSTER DIAGRAM] [INSERT TOPIC DISTRIBUTION CHART] [INSERT TOPIC SCORE ANALYSIS]
Analysis 3: User Influence on Hacker News
Methodology
To identify the most influential Hacker News users, I analysed cumulative point scores. The analysis tracked:
- Total posts (stories + comments)
- Cumulative score (total karma earned)
- Average score per post (quality metric)
- Top single post score (peak influence)
- Activity timeline (first/last post dates, posting frequency)
I created separate analyses for:
[FINDINGS TO BE ADDED]
Top users:
[INSERT TOP 10 USERS WITH STATISTICS]
Patterns observed:
[INSERT OBSERVATIONS]
- [Quality vs. quantity patterns]
- [Story posters vs. commenters]
- [Veteran vs. new user dynamics]
- [Posting frequency patterns]
- [Temporal activity trends]
Key Findings and Insights
Programming Language Trends
[INSERT MAJOR FINDINGS]
Popular Topics on Hacker News
[INSERT TOPIC INSIGHTS]
User Influence Patterns
[INSERT USER FINDINGS]
Cross-Analysis Insights
[INSERT CONNECTIONS BETWEEN ANALYSES]
Conclusions
[SUMMARY OF PROJECT OUTCOMES]
[LESSONS LEARNED]
[FUTURE DIRECTIONS]
Technical Details
Tools and Technologies
- Database: PostgreSQL with full-text search and JSONB
- Backend: Python with SQLAlchemy, Flask
- Analysis: BERTopic, sentence-transformers, scikit-learn
- Visualization: Matplotlib, Seaborn
- Deployment: [Details if applicable]